
Our research highlights that preferences vary among property searchers, and accommodating a variety of preferences in your marketing could boost interest.
Average house prices in the UK increased by 8% over the year to July 2021, according to the Office for National Statistics, with others predicting prices to continue to rise over the next few years, in part fuelled by a post-pandemic “race for space”. Whatever the state of the market, property marketers need to understand what imagery stands out and attracts property buyers.
At Image Foundry, we’ve been producing CGI for product and property marketing for over 20 years. To create CGI that gets better results, we put customer understanding at the heart of our approach. That’s why we worked with Lancaster University Management School to carry out research into property imagery and buyer behaviour.
Anshul Kapoor, co-founder and director of Image Foundry says: “Our research shows some clear trends that are highly valuable in property marketing. All property marketers are looking to create intrigue and get maximum dwell time. More images can help with this.
“Property buyers prefer several images – at least eight – and marketers can appeal to different tastes and get better results by using a variety of daytime, night-time, pristine and lived-in views.
“What if you had all these images at your disposal? It’s the difference between selling a house and selling a home.”
Read more about our approach to property marketing here
What images work best on Zoopla and Rightmove listings?
The researchers split the participants into two groups and gave them five minutes to search for properties on either Zoopla or Rightmove. Afterwards, they asked them questions about their experience
Key findings
Our research found:
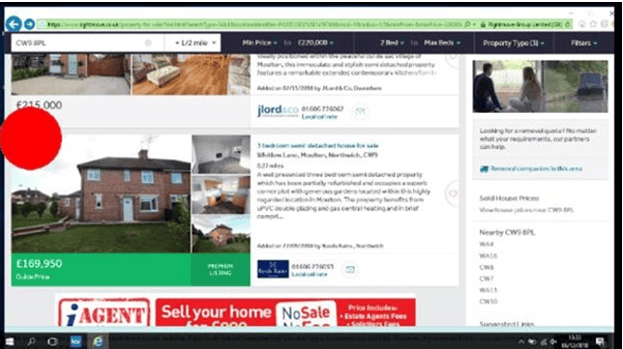
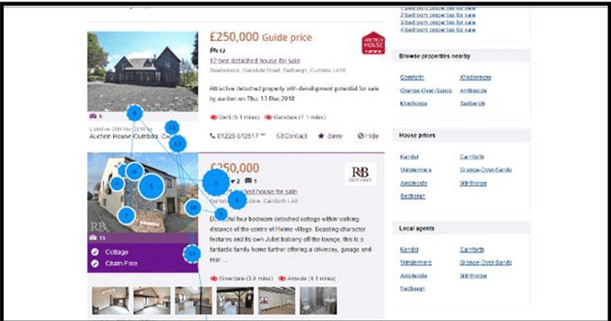
The Rightmove website displays the number of images available in the top-left of the featured image. This screenshot shows the respondent looking at the number of images available (the larger the dot, the longer the duration).
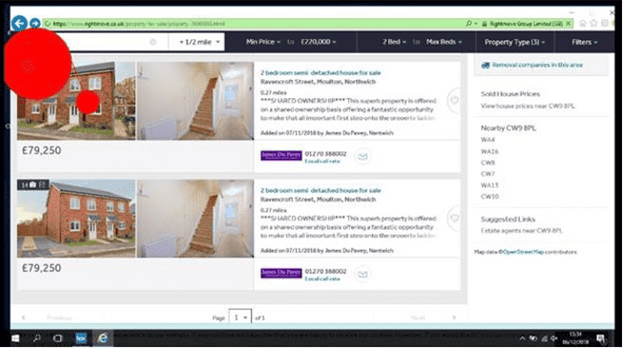
Rightmove website showing respondent looking at number of images available
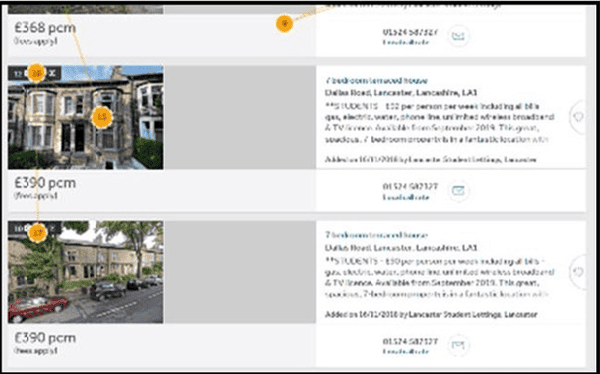
Rightmove website displaying gaze plots
– Most searchers look at eight images for each property – this was the modal number in the study. Property searchers get picture fatigue where there are lots of images.
– Premium and featured listings draw people’s gaze. Premium listings typically have a distinctive border and contain more ‘at a glance’ information. They gain a lot more attention than regular listings.
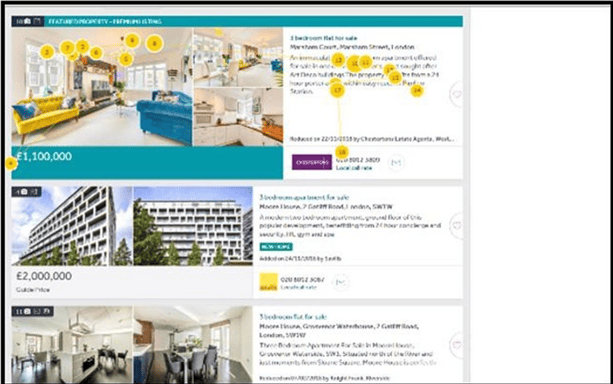
Rightmove website showing premium listings and featured properties
Zoopla website showing premium listing and feature properties
What exterior and interior images do property buyers prefer?
Participants looked at images of property exteriors and interiors styled differently and then answered questions about their preferences. The eye-tracking results were compared with their answers.
Key findings
Our research found:
Exterior images
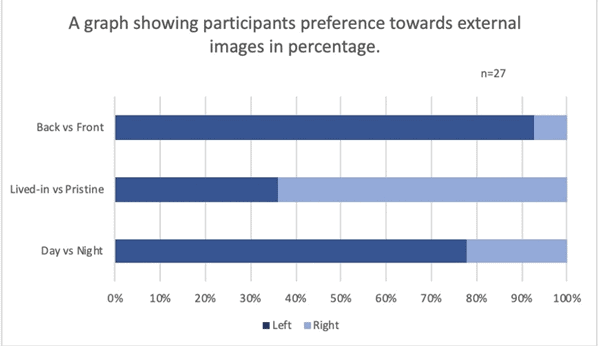
A graph showing participants’ preference for external images
Front vs back exterior

Heatmap of the front vs back exterior
93% of participants claimed to prefer the back image to the front, and the heatmaps show a wider dispersion of hotspots for the back view. One participant said the back “shows you a little bit more about the character of the house, the one from the front was a little bit too clean.” Another participant said they preferred the front because “it looked a bit more practical and accessible… you can see there [are] parking facilities, you get a bit more from the image.”
The images participants looked at featured a particularly attractive property view from the rear, undoubtedly influencing the results. We suggest that, for larger detached properties, people are more likely to be interested in the rear, which may be impressive and feature a large garden, so property developers should look to make more of rear shots in these cases.
Pristine vs lived-in

Heatmaps of the lived-in vs pristine exterior
65% of participants claim to prefer the pristine image, which was described as “quieter, and more quaint, and more homely.” Another participant said: “The left [lived-in] was too busy’ ‘I could see more of where the house was [in the pristine image], the one with the car felt like something was being obscured.”
However, the lived-in image attracted more visual attraction. Those participants claiming to prefer the lived-in image said it “‘looked more authentic’ and ‘it had more activity going on, the one on the right [pristine] looked like a box’.
Day vs night
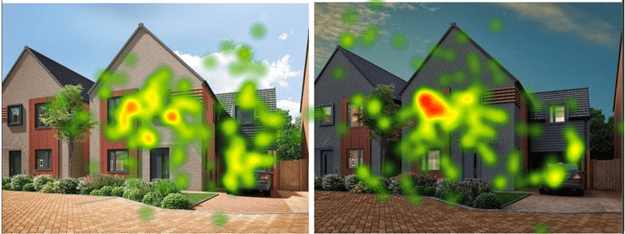
Heatmaps of the day vs night exterior
77% of participants claimed to prefer daytime exterior images, while heatmap patterns show more hotspots on night-time exterior images. The participants’ comments indicate different night-time images with warmer tones have potential. One participant commented that “you go to look at it in the daytime … Properties [are] at their best when they’re bright.” Another said they preferred the night-time image because “there’s that warmth.”
Interior images
Day vs night
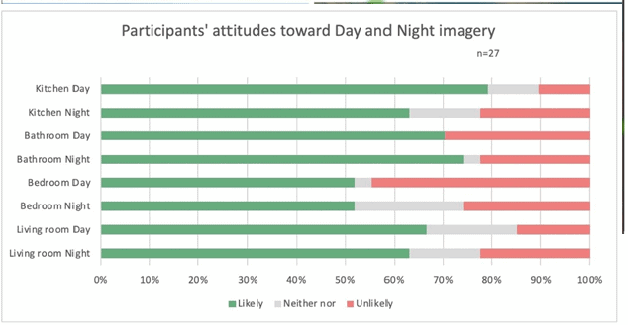
Participants were asked whether they were more likely to view the property based on daytime or night-time imagery.
Kitchens
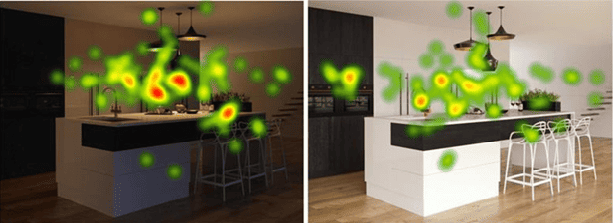
Heatmaps of the day vs night kitchen
63% of participants expressed positivity about kitchen night-time images, compared with 78% for daytime images. However, the left-hand image also shows how you can draw attention to specific items or products of interest by using focused lighting, as seen by the concentrated heat-mapping underneath the lights.
Bathrooms
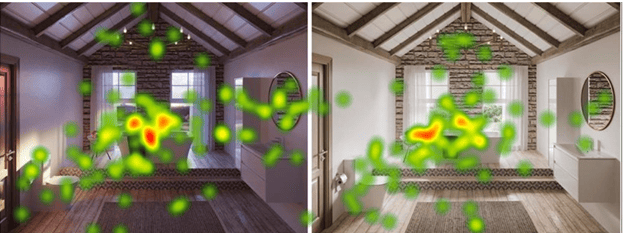
Heatmaps of the day vs night bathroom
74% of participants expressed positivity about bathroom night-time images, compared with 70% for daytime images. The heatmap shows a relatively equal pattern for each.
Bedrooms
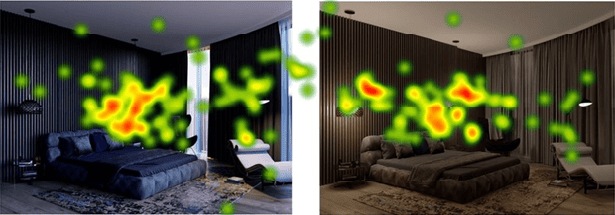
Heatmaps of the day vs night bedroom
52% of participants expressed positivity about bedroom night-time images, with the same percentage feeling positive about daytime images. The heatmap shows a relatively equal pattern for each.
Living rooms
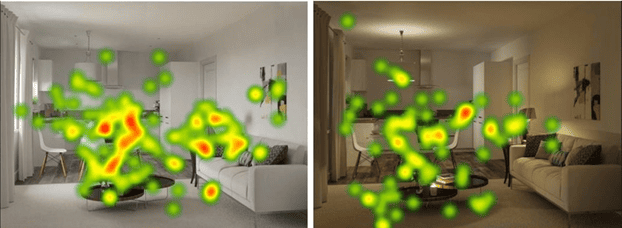
Heatmaps of the day vs night living room
63% of participants expressed positivity about bedroom night-time images, compared with 67% for daytime images. The heatmap shows a relatively equal pattern for each.
For all rooms, the research shows that a range of imagery is required to appeal to a range of tastes in people searching for properties.
Pristine vs lived-in
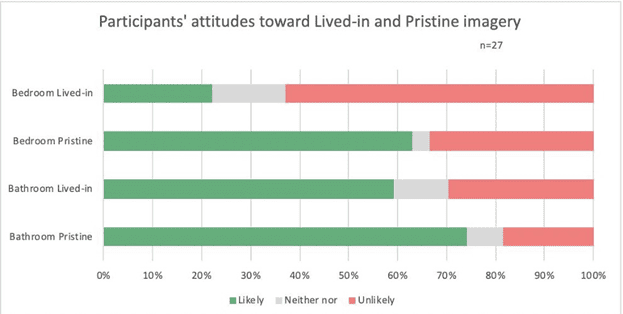
Participants were asked whether they were more likely to view the property based on a pristine image or a lived-in one.
Bedroom
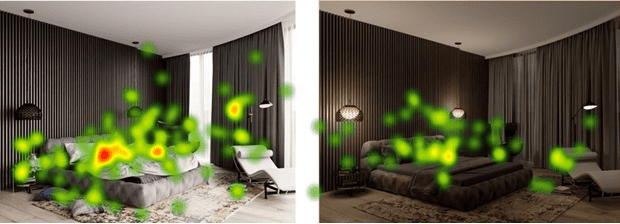
Heatmaps of the lived-in vs pristine
Despite the lived-in version being extremely untidy, 22% still said they preferred it. 63% claimed to be more likely to view the property based on the pristine bedroom image. The heatmap shows more visual attraction on the lived-in bedroom image.
Interestingly, there seems to be a place for lived-in images alongside more traditional pristine ones. However, we’d suggest a tidier version, instead making use of props tailored to the style and price of the property. Using the right images on the right channels is important too, and the lived-in imagery may be better suited to social media.
Bathroom
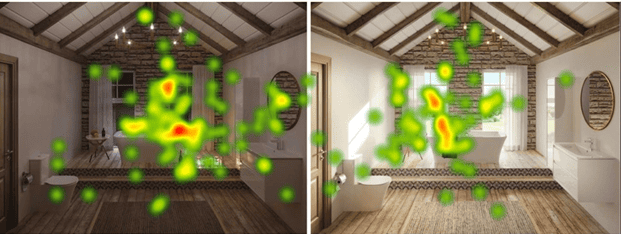
Heatmaps of the lived-in vs pristine bathroom
59% said they were more likely to view the property based on the lived-in bathroom image, compared with 74% for the pristine bathroom image. The heatmap shows more visual attraction on the lived-in bedroom image, however.
Key recommendations
Based on the findings of our research, we recommend that property marketers:
In property listings:
For property exteriors:
For property interiors:
Find out more
Read more insights into property marketing here, or find out more about the CGI we create for property marketers here.
Sources
UK House Price Index: July 2021 [Accessed 14 October 2021]
House prices forecast to rise by up to 3.5% a year between 2022 and 2024. The Guardian [Accessed 14 October 2021]
Our report:
Lancaster University Management School. Victoria Reece, Lottie Gregory, Jenny Sinker-Walsh, Ishani Dutta and Abbie Dearlove (2021). Marketing Report for Image Foundry [pdf]. Image Foundry.
Research team:
Consultants: Victoria Reece, Lottie Gregory, Jenny Sinker-Walsh, Ishani Dutta and Abbie Dearlove
Tutor: Mary Hargreaves
Lancaster University Management School
Research methodology
The researchers used eye-tracking software to measure how 27 participants responded to various property stimuli and two property websites (Rightmove and Zoopla) and compared these with their claimed preferences.
17 of 27 respondents were aged 20-24, so the data may suffer from age bias if generalised to the entire population. However, the qualitative data gathered demonstrates very similar opinions across most respondents and is useful as preliminary research into what imagery is attractive within the property market.
For more information, please contact the team at [email protected]

Is less really more when it comes to pr...